Table of Contents
1. Download and filter the time period2. How to read the CSV exports2.1 Overview export2.2 The sales exportThe CSV export includes detailed information from your show, in this article, you will find how to read and analyze it. You can export all stats in CSV format. Then you are able to import that to your analytic system. Note that importing this CSV export may need some configuration or development effort.
1. Download and filter the time period
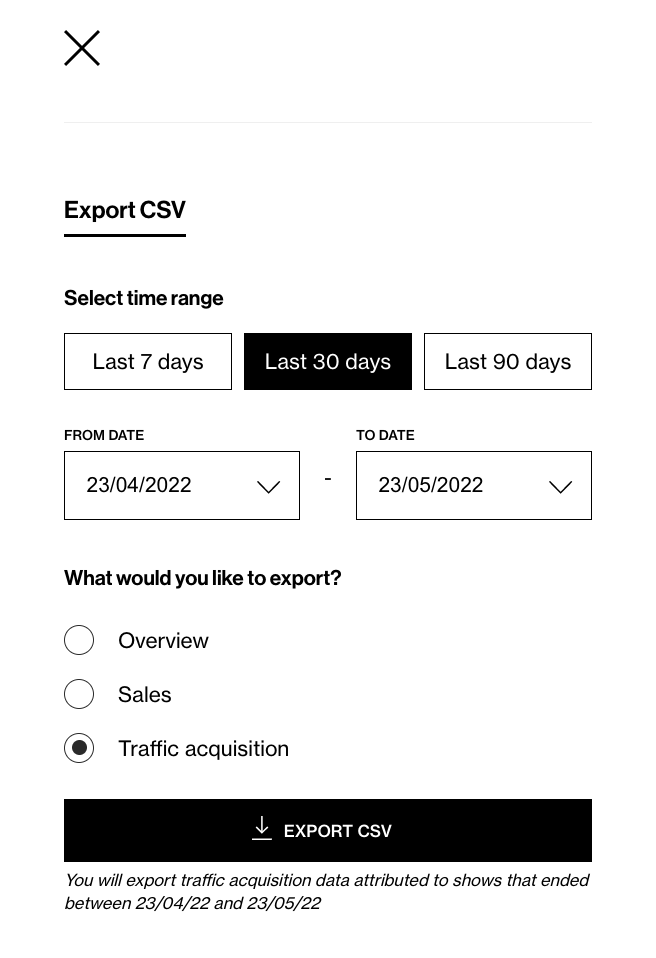
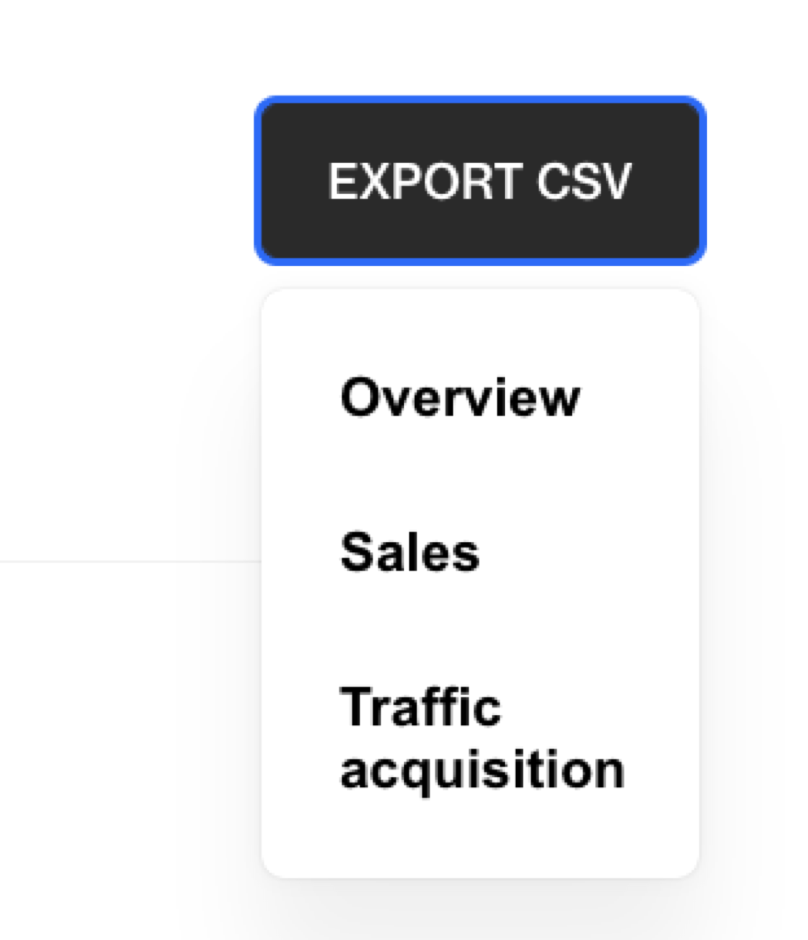
You can download the export from the stats overview page or from individually selected shows. You can select your desired time range through the filter option on the stats overview page. This allows you to select several live show performances to summarize in one report.
 |
 |
2. How to read the CSV exports
The Overview export is a one-row per show with the total performance in the selected currency for the dashboard. In the Sales export, you will get information about the purchases in both the dashboard's default currency and the currency the viewers have bought it in.
2.1 Overview export
The overview export contains all the main KPIs / metrics related to the show(s): viewers, viewing time, engagement, device, total sales, and purchases in the default currency. The single show overview export will contain only one row while the multi-show will include as many rows as the total number of shows aired in the selected period.
The following KPIs are included in the export;
Show length - the total length in seconds the live show was streaming
Views - the number of views of the live show. If a viewer watches live and proceeds to watch the recorded show (within the 30-minute session lifespan), they will be counted as one view live, one view recorded, and one view in total
Viewers - the number of unique viewers that watched the live show. A viewer can watch a show both live and recorded. They will be counted as one live viewer and one recorded viewer, but only one viewer in total. Viewers mobile & desktop - the split of unique viewers watching the live show from devices
Average Viewing Duration - how many seconds the viewers have watched the live show on average
Add to cart - divided into number of unique viewers(Viewers added to cart) and total add to cart interactions(Products added to cart)
Likes - divided into unique and total interactions
Chat - divided into unique and total interactions. Only live stats are presented because the chat function is disabled for recorded shows.
Add to calendar - the total number of times someone added the show to their calendar.
Sales currency - the currency the dashboard and player displays
Sales revenue - the total amount of sales
Purchases - the number of purchases
Sales by currency - which currencies the purchases have been made in
Sales by currency purchases - the number of purchases made in a specific currency
Sales by currency revenue - amount of sales in the currency
Sales window revenue - the number of sales within the specified period from the last interaction with the show
polls_total_answers: Total number of answers to the show’s poll(s)
The number of answered polls: Number of polls launched during the show that got at least one answer.
polls_unique_viewers_answering: Number of unique viewers who answered at least one of the show’s poll(s)
2.2 The sales export
An export to provide you with detailed information about the purchases. Please note that you can't export information for shows streamed before 18 March 2022.
Purchase date - The timestamp when the viewer made the purchase.
Value (Default Currency) - Value of the order connected to the default currency chosen in the dashboard.
Default currency - Currency of the order in chosen currency in the dashboard
Value (order currency) - Value of the order connected to the order currency
Order Currency - The currency the viewer has purchased in
Order ID - The order id of the purchase
Order Products IDs - The IDs for the products in the purchase order
Days Since Last Interaction - Number of days between when the sales happened and the last interaction with the Bambuser solution.( Days used for the attribution window). EG days since the last interaction=5 means that the sales happened 5 days after the interaction with the Bamburser product)
2.3 CSV export interactions
- interactions_total_add_to_cart_total_total: total number of add to cart clicks (live and on demand add to cart clicks)
- interactions_live_add_to_cart_total: total number of add to card clicks happened during the show is live
- interactions_recorded_add_to_cart_total: total number of add to card clicks happened after the show is over
- interactions_total_add_to_cart_total_total is displayed as Total under Products added to cart in the dashboard and it is the sum of interactions_live_add_to_cart_total and interactions_recorded_add_to_cart_total. (Those are displayed as live and recorded under the total)
- interactions_total_add_to_cart_unique: distinct number of viewers who added a product to cart
- interactions_live_add_to_cart_unique: distinct number of viewers who did an add to cart click during the show is live
- interactions_recorded_add_to_cart_unique: distinct number of viewers who did an add to cart click after the show is over (during an on demand view)
- interactions_total_add_to_cart_unique is displayed as Total under Viewers added to cart section in the dashboard and it is the sum of interactios_live_add_to_cart_unique and interactions_recorded_add_to_cart_total (Those are displayed as live and recorded under the total)
2.4 Traffic acquisition
The traffic acquisition CSV exports include the data utilized in the graphical visualization in the stats show report plus some show identification fields (show id, show title show started at). Here you can find the list of KPIs included:
| Total | Organic | Organic Direct | Organic Fab | Organic Channels |
| Multistream | Multistream: Facebook | Multistream Youtube | Multistream Other | Share |
Each KPI is divided between
- Clicks
- Viewers